Infographics about Aboriginal culture – save time & stand out!
Infographics available for download
-
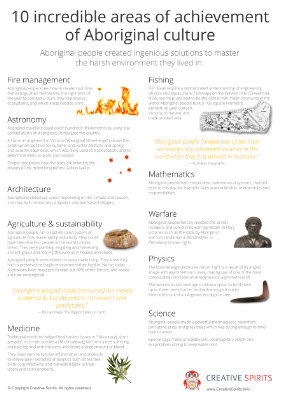
10 Incredible Areas of Achievement of Aboriginal Culture

-
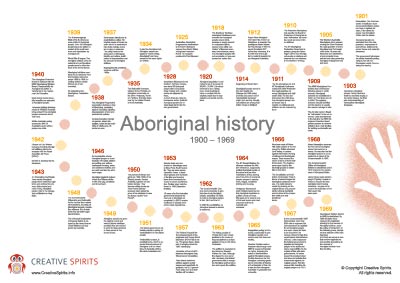
Aboriginal history 1900 - 1969
-
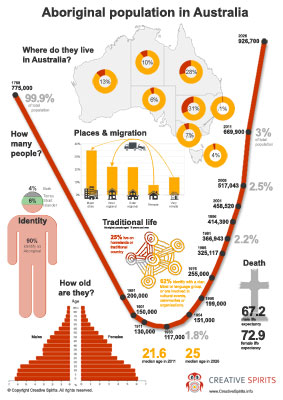
Aboriginal population
-
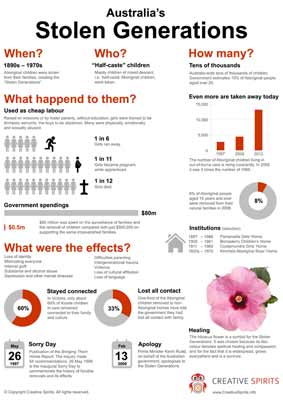
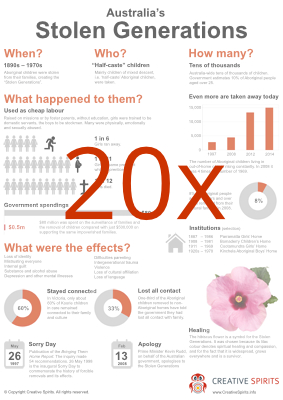
Australia's Stolen Generations
-
Australia’s Stolen Generations (bulk, 20 licenses)
-
Explainer: Uluru Statement From the Heart

-
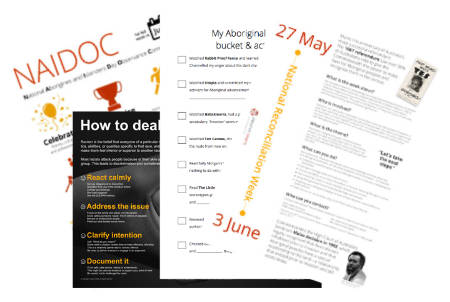
How to deal with racist people?

-
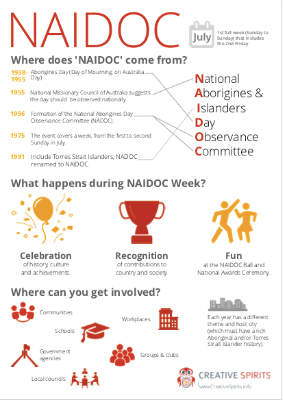
NAIDOC Week
-
NAIDOC Week bundle
-
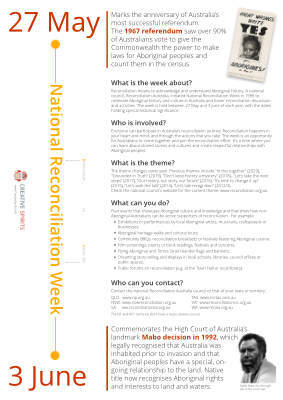
National Reconciliation Week
Creative Spirits' infographics—
use your advantage!
Improve your assignments or lessons right now without having to spend a lot of money. Professional infographics cost $1,000 to $5,000, including research, to produce.
All infographics have been thoroughly designed by Creative Spirits to be visually engaging and informative. They condense data on a single page and invite to explore and learn, and are available instantly after download.
Creative Spirits' infographics can be easily printed on regular paper--no super-tall graphics you would need to cut and glue together.
Fact
41.5% of marketers agree that infographics are the most engaging visuals. [1]
I have purchased a few of your posters which I think are fantastic and share them on my wall. Love your work.
— Paula S., Aboriginal Education worker
[Your] infographics are a valuable tool in education.
— Jim Cain, Aboriginal Alcohol and Drug Worker, Cyrenian House Therapeutic Community
I've found it very useful to work with infographics in the classroom – students today relate to them easily, and they do transport a lot of information as well as a lot of valuable vocabulary for English language learners.
— Katharina, teacher
What are infographics?
Information graphics or infographics are visual representations of information and data to present information concise, quickly and clearly.
Infographics express complex messages in a way that enhances comprehension. Contrary to images they convey a self-contained message or principle and can stand on their own. They are a blend of arts, statistics, information and design. Good infographics have a story and don't just entertain.
Infographics are used
- to communicate a message,
- to present a lot of data or information in a way that is concise, compact and easy to comprehend,
- to analyse data in order to see patterns and trends, and to discover cause-and-effect relationships,
- to periodically monitor the route of certain parameters.
Infographics are 30% more likely to be read than text articles, and 40% of people respond better to visual information than just text. [2]
Infographics have the great advantage that they are also accessible to
- very young children,
- English language learners,
- struggling readers, and
- visual learners.
How can you use infographics in the classroom?
Infographics are well suited to be used in the classroom. Worldwide high school teachers have used infographics as an aid in teaching their students.
Students can save a lot of time in reading and understanding infographics as compared to reading a traditional article. They educate students about graphical representations and build contemporary information literacy.
As it gets harder to keep students' attention, visual tools transform complex data and difficult lessons into an engaging experience. Teachers can use eye-catching, easily shareable, engaging and understandable educational infographics on just about any subject, such as history, social studies, math, science, arts, literature, and languages.
90% of surveyed students, teachers, and parents said technology helps students’ abilities to learn, while 82% also noted that technology needs to play a bigger role in classrooms. [3]
Teachers can use infographics as effective methods in lessons as
- the basis or discussion-starter for a debate topic,
- visual read-aloud/think-aloud activities,
- a digital game if the infographic has a question flow,
- a visual aids for complex topics,
- an introduction or overview of a lesson,
- an alternative to essay writing,
- homework for students,
- a tool for presentation, or
- a tool for reporting.,
For an infographic teacher-toolkit check out www.calacademy.org.
Students creating their own infographic
Courses that teach students to create their own infographics using a variety of tools can encourage engagement in the classroom and may lead to a better understanding of the concepts they are mapping onto the graphics.
Researchers found that an infographic assignment inspires students to practice strong multi-modal communication skills without requiring the instructor to rehearse basic composition lessons. [4]
There are two core concepts students learn when creating their own infographics:
Visually representing data is the understanding of use of different graphs, tables, charts and images on the infographics. Students learn how to analyse and interpret the data to ensure they understand it.
Critiquing infographics allows students to tell the good and bad sides of an infographic. Ideally they use a rubric, a criteria or list they can judge the infographic against.